
When monthly reporting begins with files scattered across inboxes, shared folders, and individual workbooks, the challenge is not simply putting the numbers in one place. It is knowing which file is current, whether each figure belongs to the same period, and what changed enough to deserve management’s attention.
The result can be a report that takes effort to assemble but is still difficult to review. Managers need to understand the figures, the reasons behind significant movements, and any decisions or follow-up actions, not trace a number through several spreadsheets.
A reliable monthly process brings the inputs together, checks them, and makes the resulting report easy for a person to review before it is shared.
Why scattered Excel files are hard to review
Separate files often reflect different ways of working. One team may use a department name while another uses a branch name. A workbook may contain several months, while another has only the latest period. Some files may be updated after they were first shared, and their filenames may not make the change clear.
Even when the data is broadly consistent, manual consolidation makes it harder to trace a reported figure back to its source. A copied value may be separated from its original context, a formula may point to an older tab, or a missing file may go unnoticed. When that happens, a reviewer has to spend time asking how the report was built instead of assessing what it says.
A reviewable report needs a repeatable path from source files to final output. It should also make gaps, assumptions, and unresolved items visible rather than hide them behind a polished chart.
A four-step monthly path
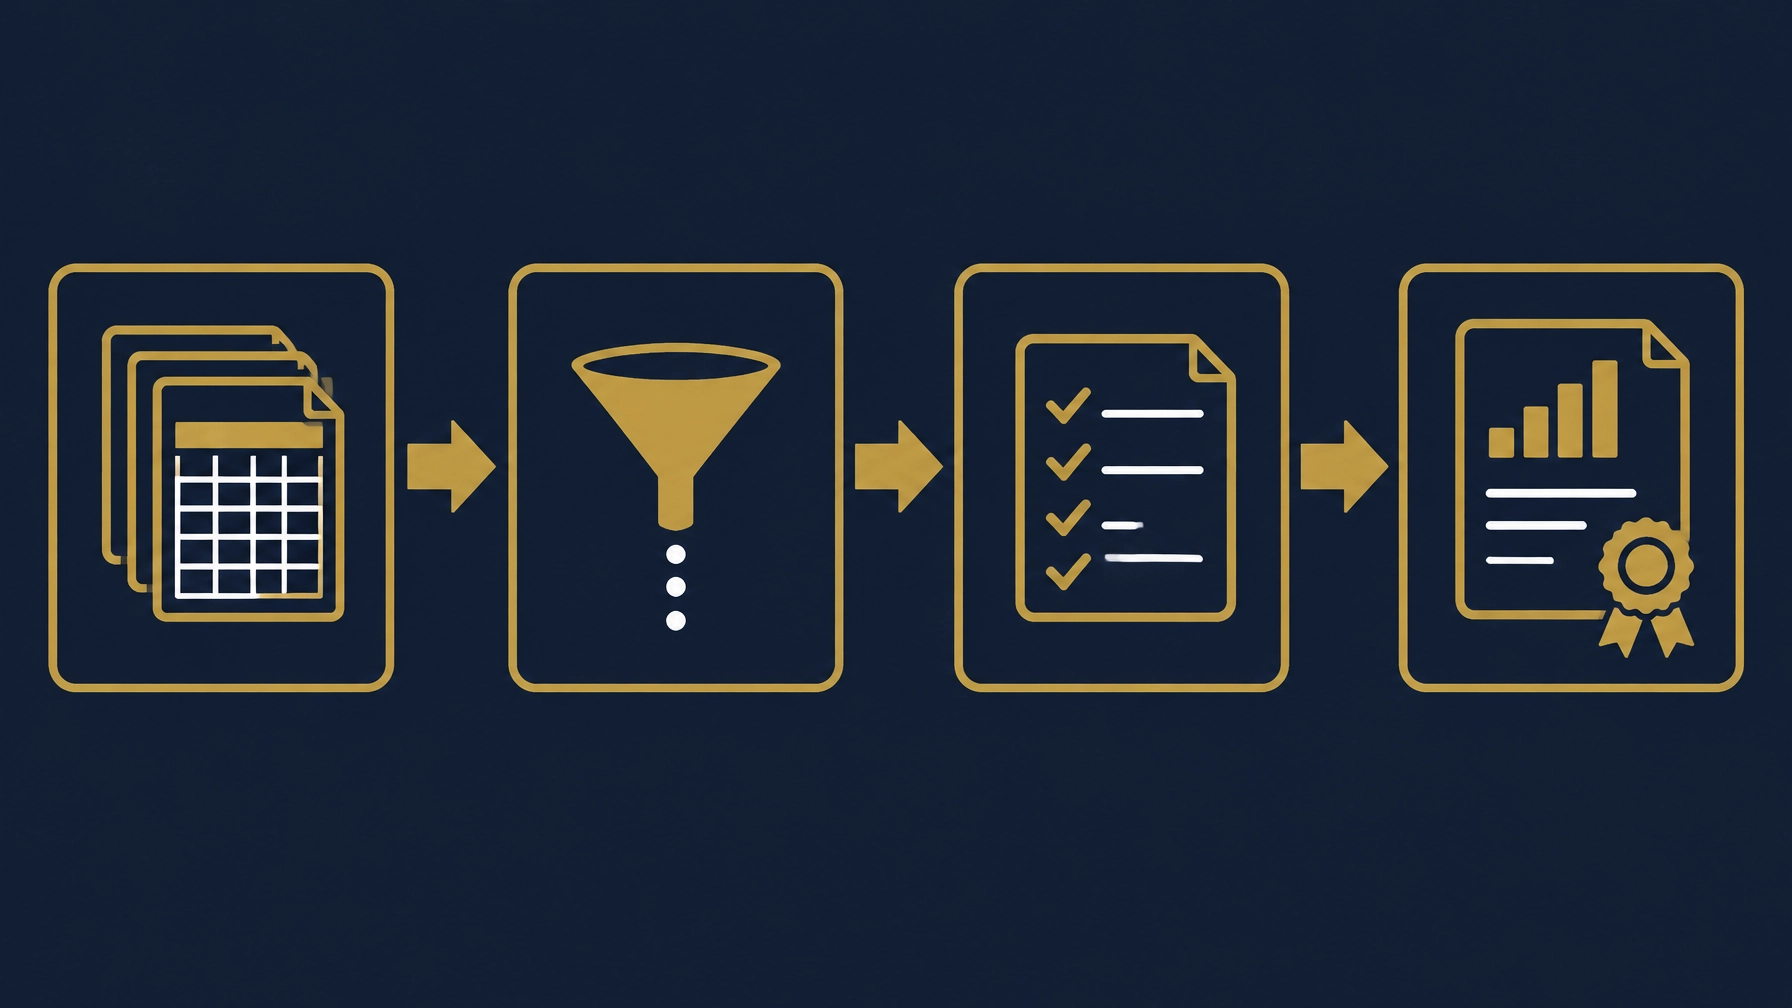
1. Set the reporting scope and collect inputs
Start by defining what the report covers: the reporting period, included teams or branches, key financial and operating measures, and the person responsible for each input.
Keep a simple input register that shows which files are expected, who provides them, what period they cover, and whether they have been received and checked. Preserve the original files so a reviewer can distinguish source data from later changes. If a file is missing or unreadable, flag it as an exception, do not treat it as a zero or quietly use an older version.
This first step creates a shared understanding of what should be included before consolidation begins.
2. Standardize and consolidate the data
Before combining files, agree how common fields should be represented. This may include dates, department names, account categories, business units, currencies, and actual-versus-plan labels. Keep the original labels where useful, and document how they map to the reporting categories.
A repeatable process can then bring the inputs into a consistent structure. For example, Microsoft documents how Power Query can connect to data, apply transformations, and save those steps as a refreshable query (source: Microsoft Learn). Whether a workflow uses Power Query or another suitable method, the important point is that the consolidation rules can be reviewed and repeated, not recreated from memory every month.
3. Validate figures and make exceptions visible
Consolidated data still needs checks. Confirm that the expected files and reporting periods are present. Check that required columns are populated, totals reconcile to their source files, and repeated records or unexpected categories are identified.
Keep an exception log for issues that need attention. Each item should describe what is affected, what is known, who will review it, and whether it has been resolved or remains open. A reviewer should be able to see where a figure came from and what needs judgment.
Where actuals are compared with budget or forecast, show the comparison clearly. For significant movements, record the likely driver and its evidence; do not let a chart or a brief label stand in for an explanation.
4. Prepare a draft for human review
Once the figures and checks are in place, prepare a draft report that presents the main messages alongside supporting detail. Make the reporting period and comparison basis clear on each relevant section.
The reviewer should be able to question unusual movements, check explanations against source information, and request corrections. The final version should be identifiable so everyone knows which report was reviewed and approved. Automation can prepare the data and draft; a responsible person should decide whether the report is ready to share.
What a good monthly management report contains
A useful report is organized around the decisions managers need to make, not around every available spreadsheet tab. Depending on the business, it may include:
- A short executive summary: the main developments, open questions, and decisions or follow-up needed.
- A financial view: key revenue, cost, margin, and cash measures, with the chosen comparison clearly stated.
- Relevant operational measures: indicators that help explain the financial picture, such as activity, delivery, or customer trends.
- Variance explanations: the movement, its known driver, and whether it appears temporary or ongoing.
- Actions and ownership: the next step, the person responsible, and the point at which it should be revisited.
Keep the headline view concise and provide supporting detail where it helps a reader investigate. A well-designed dashboard is useful when it makes the figures easier to understand, but it should not replace definitions, context, or review.

Common mistakes to avoid
Copying and pasting without a consistent method: Small layout or formula differences can make a recurring report difficult to reproduce and verify.
Treating missing data as zero: A missing input is an issue to flag, not a value to assume.
Changing definitions from month to month: If teams, categories, or KPIs are defined differently each time, comparisons become harder to interpret.
Showing movement without explaining it: A variance needs a documented cause or a clear note that its cause is still being investigated.
Sharing an unchecked draft: A professional-looking report can still contain stale or inconsistent information. Keep human review and approval before sending.
How Basetaa’s ReportFlow service helps
Basetaa’s ReportFlow is a custom setup and automation service, not a ready-made SaaS product. The work starts by understanding how your current files, reporting steps, and review responsibilities fit together.
Depending on the workflow, a setup may organize inputs, standardize recurring data preparation, check formulas and source totals, and prepare a report or summary for review. The exact scope is shaped around the way your business works and the tools already in use. The aim is to make the reporting process clearer while keeping its assumptions and exceptions visible.
Frequently asked questions
Do we need to replace Excel to improve monthly reporting?
Not necessarily. The right approach depends on the files, tools, and reporting steps already in use. In some workflows, the process can be made more consistent while keeping Excel as part of the preparation or review process.
How should we handle a missing or late file?
Record it as an open exception, identify the owner, and make clear which part of the report may be affected. Avoid treating missing information as zero or silently substituting an older file.
Can automation send the report automatically?
A reporting workflow can prepare files or drafts, but sending should follow an agreed approval process. Basetaa’s approach keeps human review and approval in place before anything is sent.
What makes a monthly report reviewable?
A reviewer can understand the reporting period and comparison basis, trace key figures to their sources, see what has been checked, and identify open questions and actions.